活断層・古地震研究報告 第3号 トップへ
活断層情報から推定した不均質応力場中の動的破壊過程のシミュレーション : 上町断層系・生駒断層系への応用
加瀬祐子・関口春子・石山達也・堀川晴央・佐竹健治・杉山雄一
現実的な震源モデルを作成するため、水平方向の不均質な応力場を考慮して、動的な破壊過程のシミュレーションを行った。応力場の不均質は、平均上下変位速度の分布と断層形状から求めた。この方法を用いて、大阪堆積盆地内の活断層である上町断層系と生駒断層系の動的破壊過程を計算した。数値計算の結果、破壊の伝播はかなりなめらかではあるが、不均質なすべりの分布が得られた。破壊が生じる面積は、断層形状と震源の位置に依存する。応力降下量の大きい領域が広く分布する部分に震源がある場合、破壊面積も大きくなる傾向がある。
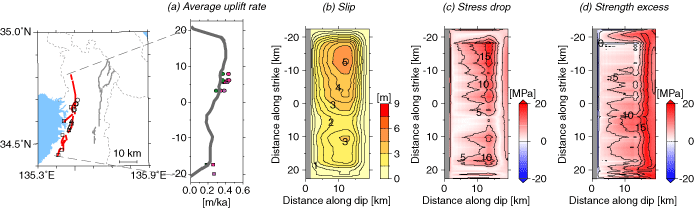
第1図
第1図. 上町断層系を1セグメントとした場合の初期応力分布。灰色の部分は、破壊が起こらない部分 (堆積層内) を示す。(a) 上町断層系の平均上下変位速度分布 (関口ほか 2003)。(b) 関口ほか (2003) で推定された断層面上のすべり量分布。(c) 関口ほか (2003) で推定された断層面上の応力降下量分布。(d) 応力降下量分布から求めた断層面上の強度分布。
Fig. 1. Heterogeneous distribution of initial stress field for the Uemachi fault system (1-segment model). Grey areas indicate where rupture does not occur inside sediment layer. (a) Average uplift rate along fault trace (Sekiguchi et al., 2003). (b) Slip distribution on the fault estimated by Sekiguchi et al. (2003). (c) Stress drop distribution on fault estimated by Sekiguchi et al. (2003). (d) Strength excess distribution on fault estimated from the stress drop distribution.
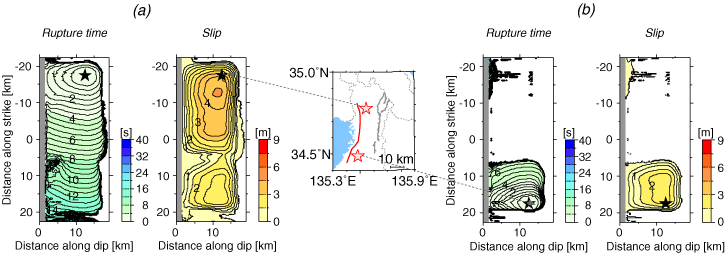
第2図
第2図. 上町断層系を1セグメントとした場合の破壊過程。(a) 破壊開始点を断層系の北端に置いた場合。(b) 破壊開始点を断層系の南端に置いた場合。
Fig. 2. Rupture processes of the Uemachi fault system (1-segment model). (a) A hypocenter is located near the northern end of the fault system. (b) A hypocenter is located near the southern end of the fault system.