活断層・古地震研究報告 第2号 トップへ
上町断層系の動的破壊過程の推定
加瀬祐子・堀川晴央・関口春子・佐竹健治・杉山雄一
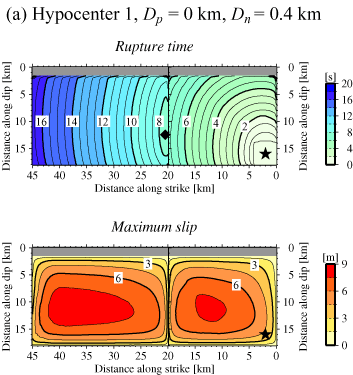
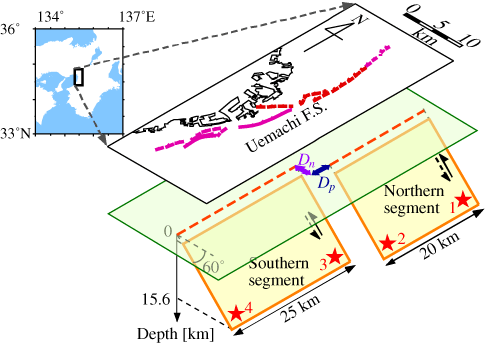
上町断層系をモデルとして (第1図)、2つのセグメントから構成される逆断層系での自発的な破壊伝播過程を数値計算で求めた。用いる断層モデルは、地表の断層トレースと反射法探査結果から構築し、応力場は、広域的な応力場から推定した。破壊開始点とセグメント間の距離を様々に変えて、それらが地震の大きさや破壊伝播過程に与える影響を調べた (第2図)。断層系の端から破壊が始まり、セグメントが近接しているほど、破壊はなめらかに2つのセグメント間を乗り移ることができる。
第1図
第1図. 断層モデル。地図 (水野ほか, 2002 による) 上のピンク色実線、ピンク色点線、赤線は、それぞれ、活断層 (主として後期更新世以降に活動したもの)、推定活断層、沖積面下に伏在する活断層を示す。Dp と Dn は、それぞれ、断層に平行な方向、直交する方向の距離を示す。星印は破壊開始点の位置の候補を示す。
Fig. 1. Fault model used in this study. In a map after Mizuno et al. (2002), pink solid and dotted lines indicate active faults (mainly active in the Late Pleistocene and Holocene) and inferred active faults, respectively. Red lines indicate active faults concealed beneath the alluvial plain. Dp and Dn indicate fault-parallel and fault-normal distances, respectively. Red stars are candidate locations for an initial crack.
第2図
第2図. 破壊開始点の位置を変化させたときの、それぞれの破壊時刻 (上) とすべり量 (下) の分布。星印は破壊開始点、菱形は破壊が乗り移った点を示す。
Fig. 2. Rupture time (upper diagram) and slip distributions (lower diagram) for four different initial crack locations. Stars indicate initial crack locations. Diamonds indicate locations where ruptures jump.