活断層・古地震研究報告 第2号 トップへ
栃木県関谷断層の活動履歴調査 (2)
-塩原町関谷におけるトレンチ調査結果-
宮下由香里・下川浩一・寒川 旭・杉山雄一・丸山直樹・大石 朗・斎藤 勝
栃木県関谷断層全体の活動履歴の解明を目的として、同断層南部に位置する塩原町関谷においてトレンチ掘削調査を行った (第1図)。その結果、関谷地区においても、同断層北部百村地区で認められた2回の断層活動とほぼ同時期の活動が確認された (第2図、第3図)。さらに、6千〜8.4千年前頃にも活動があったことが新たに見いだされた (第4図)。
第1図
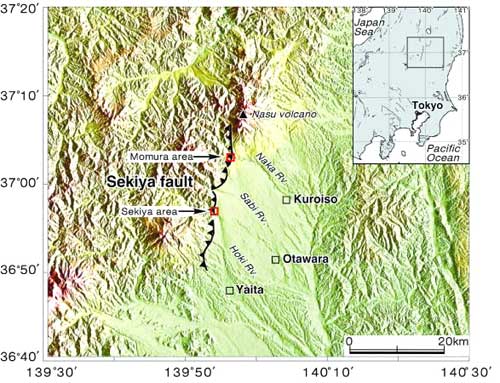
第1図. 関谷断層位置図。断層線の位置は山元ほか (2000) による。陰影図の作成には国土地理院発行の国土数値情報50mメッシュ (DEM) を使用。
Fig. 1. Index map and detailed distribution of the Sekiya fault. Digital Map 50m Grid (Elevation) of the Geographical Survey Institute is used for arranging the background topographic map.
第2図
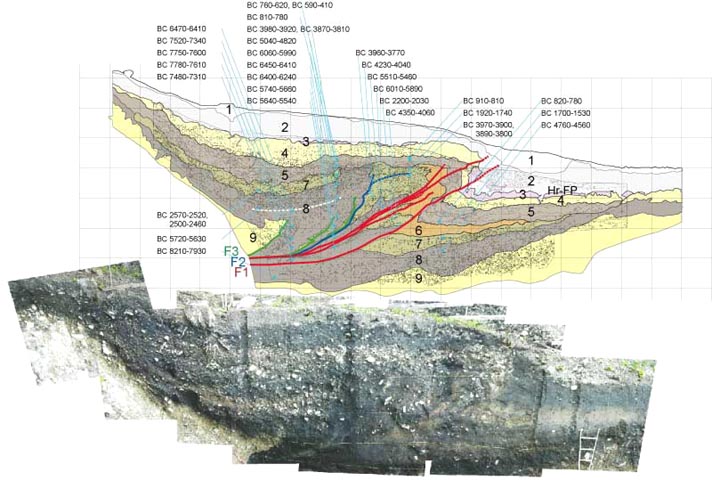
第2図. トレンチ北側壁面の写真とスケッチ及び14C年代値。
Fig. 2. Photograph and log of the north wall of the trench and 14C ages (cal AD/BC; 1σ).
第3図
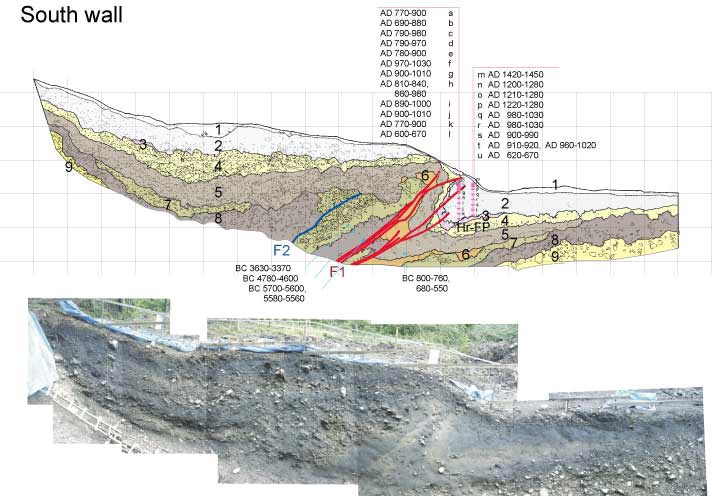
第3図. トレンチ南側壁面の写真とスケッチ (反転) 及び14C年代値。
Fig. 3. Flipped-over photograph and log of the south wall of the trench and 14C ages (cal AD/BC; 1σ).
第4図
第4図. 関谷トレンチと百村トレンチの各層から得られた14C年代とイベントの推定時期。
白抜きバーは 1σ、黒いバーは 2σ を表す。
Fig. 4. Diagrams showing 14C ages obtained from each layer in the Sekiya and Momura trenches, and estimated timings of the faulting events. White rectangles mean 1σ and thick lines mean 2σ, respectively.