活断層・古地震研究報告 第2号 トップへ
大阪平野における地震動予測の試み
-動的地震破壊シナリオと3次元地下構造モデルによる地震動計算-
関口春子・加瀬祐子・堀川晴央・佐竹健治・杉山雄一・Arben Pitarka
センターが取り組む地震動予測研究として、大阪平野における上町断層系の地震動予測を行った (第1図)。加瀬・他 (2002、本報告) より推定されたシナリオに対し、堀川・他 (2002、本報告) による三次元地下構造モデルにおける地震動シミュレーションを行った。震源が近いため、強震動分布は第一義的には震源過程、特に、前方指向性の現われ方に依存する。さらに、堆積層での増幅、基盤岩上面の段差構造による干渉など、地下構造による影響を受ける (第2図)。
第1図
第1図. 地震動シミュレーションの計算空間。
Fig. 1. Space for ground motion simulation.
第2図
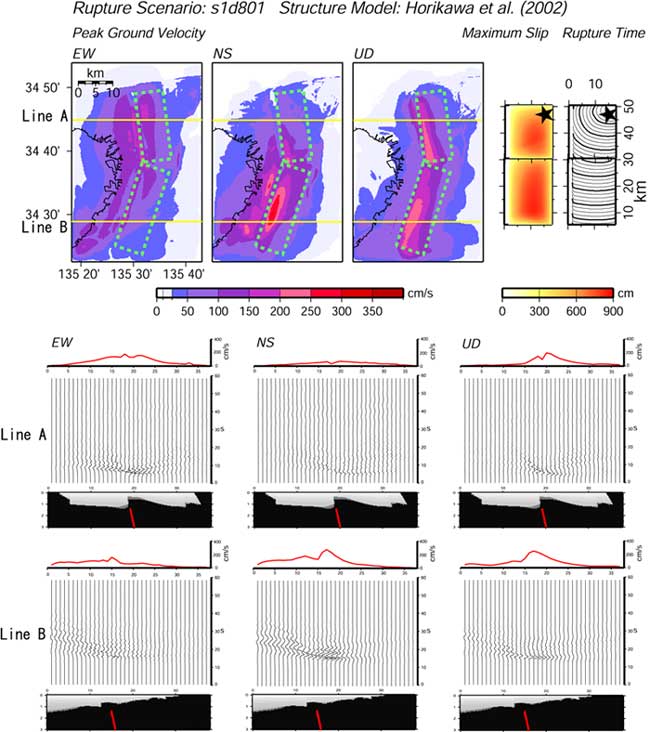
第2図. (上) 破壊シナリオs1d801、堀川ほか (2002) の地下構造モデルによる最大地動速度の東西成分、南北成分、上下成分、断層面上の最大すべり量分布、破壊時刻の分布 (細いコンターは0.5秒間隔、太いコンターは2.0秒間隔) が示されている。地図中の緑色の点線は、断層面の地表面上への投影位置を示す。(下) 上記地図中の黄色線の測線上の点で計算された最大地動速度振幅分布、地震動速度波形と、この測線直下の地下構造断面。左から東西成分、南北成分、上下成分。
Fig. 2. (Top) Peak ground velocity distribution of simulated ground motion from rupture scenario s1d801 and the three-dimensional velocity structure of Horikawa et al. (2002). Maximum slip distribution on the fault planes and the rupture time (thin contours at 0.5s interval, thick contours at 2.0 s interval) for the scenario are also illustrated. Green dashed lines in the map indicate the fault planes projected onto the Earth surface. (Bottom) Simulated ground motion waveforms of EW, NS and UD components along the lines A and B indicated in the map above. The peak ground velocity distribution along the lines and underground structure beneath the lines are also illustrated.