Bulletin of the Geological Survey of Japan Top Page
Bulletin of the Geological Survey of Japan Vol.70 No.3 (2019)
Cover figure | Table of Contents | Abstract
Cover figure
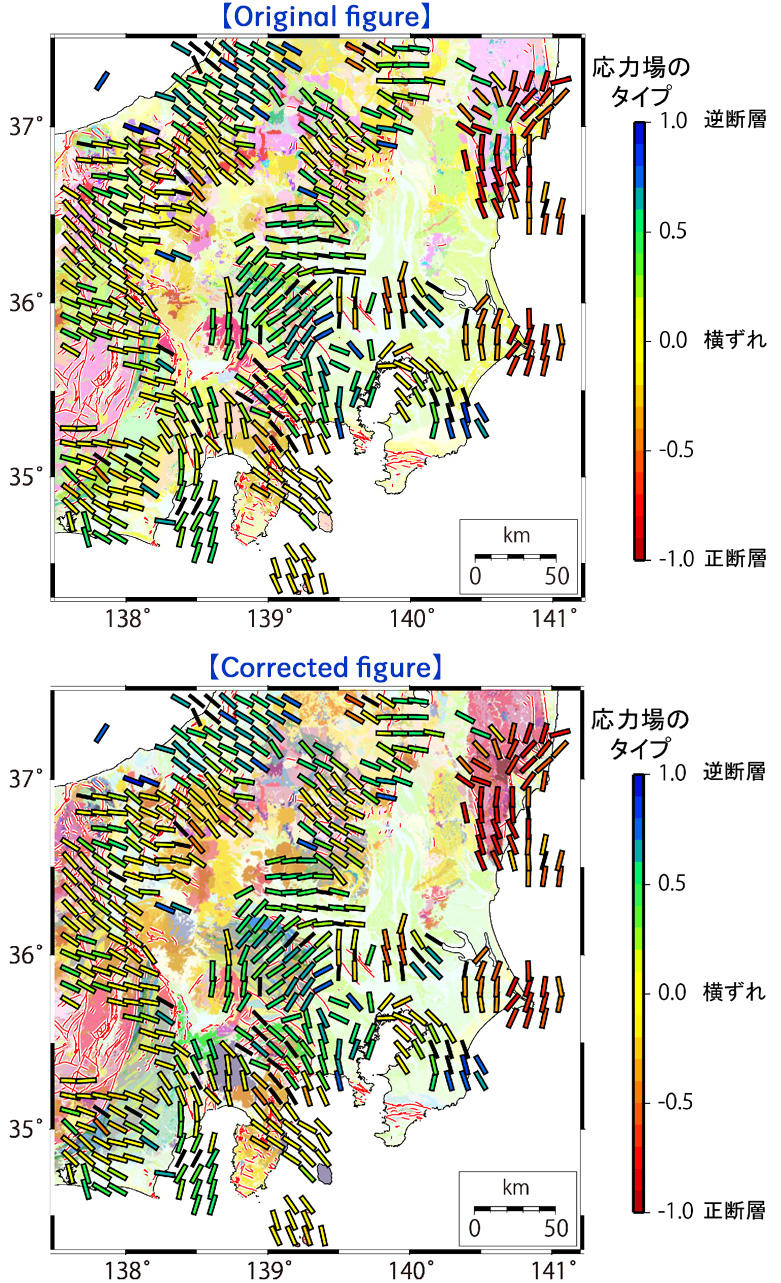
Crustal stress map in the Kanto region
The 10 km-mesh map of the crustal stress in the Kanto region was constructed based on the analysis of seismic data. The direction of the maximum horizontal compressive stress is shown by bars, which are color-coded by the type of stress field. Black bars indicate that their stress type could not be determined. By analyzing small earthquakes in the past 14 years, the spatial resolution of the stress fields has been significantly improved compared to previous studies, revealing a complex stress pattern in the region. For details, see Imanishi et al. (2019) in this issue. Red lines are active faults (Research Group for Active Faults of Japan (1991)).
The base map is the Seamless Digital Geological Map V2 of Japan (1:200,000) (https://gbank.gsj.jp/seamless/v2/viewer/ April 15, 2019).
Correction in the figure (cover)
The base map has been updated to the latest version (V2) of the Seamless Digital Geological Map of Japan (1:200,000).
July 11, 2019
(Text and figure by Kazutoshi Imanishi, Takahiko Uchide, Makiko Ohtani, Reiken Matsushita and Misato Nakai)
Table of Contents
All the pages PDF : 70_03_full.pdf [18MB]
| Title | Author | |
|---|---|---|
| Article | ||
| Construction of Crustal Stress Map in Kanto Region, central Japan | Kazutoshi Imanishi, Takahiko Uchide, Makiko Ohtani, Reiken Matsushita and Misato Nakai (p273-298) | 70_03_01.pdf [11.5MB] |
| Report | ||
| Zircon U–Pb ages of the Kashiwagi Unit of the accretionary complex in the Northern Chichibu Belt, Kanto Mountains, central Japan | Kohei Tominaga, Hidetoshi Hara and Tetsuya Tokiwa (p299-314) | 70_03_02.pdf [5.3MB] |
Abstract
Construction of Crustal Stress Map in Kanto Region, central Japan
Kazutoshi Imanishi, Takahiko Uchide, Makiko Ohtani, Reiken Matsushita and Misato Nakai
We constructed a crustal stress map of the Kanto region, central Japan, from earthquake focal mechanism solutions. In order to increase the spatial resolution of the stress map, we included more data than the routine catalog by determining focal mechanisms of small earthquakes down to magnitude 1.5 in approximately the past 14 years. We obtained 1142 well-constrained solutions using P-wave polarity data as well as body wave amplitudes, which successfully filled the gap in the stress fields left by previous studies. We merged our focal mechanism catalog with the Japan Meteorological Agency earthquake catalog and that of our previous studies, which have become a source of information on the stress map. For each earthquake, we estimated the direction of the maximum horizontal compressive stress (SHmax) based on plunge angle of the P-, B-, and T-axes. The type of stress field was also determined using rake angles, which provide a single scalar value on a continuous scale varying from −1 (normal faulting) to 0 (strike-slip faulting) to +1 (reverse faulting). We then computed the mean SHmax and type of stress field on a mesh interval of 10 km, which we refer to as a stress map. Compared with previous stress maps in the present study area, our map succeeds in reducing the blank area of stress information and provides higher spatial resolution in stress fields. The stress map reveals a complex stress pattern, which includes sudden changes in the SHmax direction, clockwise SHmax rotation from the Izu Peninsula to its north area, the existence of multiple tectonic stress provinces in the spatial scale of a few 10 km, and normal-faulting stress fields prevailing in the coastal region of the Pacific Ocean. These features are important for understanding local tectonics and evaluating future earthquake risk in this area.
Zircon U–Pb ages of the Kashiwagi Unit of the accretionary complex in the Northern Chichibu Belt, Kanto Mountains, central Japan
Kohei Tominaga, Hidetoshi Hara and Tetsuya Tokiwa
The Kashiwagi Unit is the youngest unit in the Northern Chichibu accretionary complex. In this study, we measured zircon U–Pb ages from sandstone and felsic tuffaceous phyllite in the Kashiwagi Unit to determine their depositional ages. As a result, we obtained depositional age of 128.2±1.4 Ma and 126.7±2.0 Ma from two sandstone samples and 134.2±1.5 Ma from a felsic tuffaceous phyllite sample. The depositional age of this unit was previously estimated by radiolarian fossils from shale and siliceous shale, presenting a wide range from the Middle Jurassic to Early Cretaceous. The zircon U–Pb ages from the sandstones are assigned as the Early Cretaceous, presenting younger than the radiolarian age. Detrital zircon U–Pb ages of sandstone suggest that the uppermost age of the ocean plate stratigraphy of the Kashiwagi Unit is younger than the Barremian age.
Geological Survey of Japan, AIST
- About GSJ
- Our Activities
- Purchase guide
-
Publications and Database
- information
-
Bulletin of the Geological Survey of Japan
- bull2026(Vol.77)
- bull2025(Vol.76)
- bull2024(Vol.75)
- bull2023(Vol.74)
- bull2022(Vol.73)
- bull2021(Vol.72)
- bull2020(Vol.71)
- bull2019(Vol.70)
- bull2018(Vol.69)
- bull2017(Vol.68)
- bull2016(Vol.67)
- bull2015(Vol.66)
- bull2014(Vol.65)
- bull2013(Vol.64)
- bull2012(Vol.63)
- bull2011(Vol.62)
- bull2010(Vol.61)
- bull2009(Vol.60)
- bull2008(Vol.59)
- bull2007(Vol.58)
- bull2006(Vol.57)
- bull2005(Vol.56)
- bull2004(Vol.55)
- bull2003(Vol.54)
- bull2002(Vol.53)
- bull2001(Vol.52)
- Bulletin of the Geological Survey of Japan(old)
- Annual Report on Active Fault and Paleoearthquake Researches
- Reports, Geological Survey of Japan
- CCOP-GSJ Groundwater Project Report
- CCOP Technical Bulletin
- Cruise Report
- Geological Hazards
- Learning and Education
- GSJ Database Collection
- Collection of links