Destructive earthquakes in southern Turkey(2023) top
Destructive earthquakes in southern Turkey on 6th February 2023 (Mw7.8 and Mw7.5)
The sixth report "Primary surface rupture and slip distribution associated with Mw7.8 and Mw7.5 earthquakes in southern Turkey"
KONDO Hisao and IMANISHI Kazutoshi (Research Institute of Earthquake and Volcano Geology)
Selim Özalp (General Directorate of the Mineral Research and Exploration of Turkey (MTA))
(Additional interpretation and remarks on 6th April 2023)
We have reported the surface rupture and slip distribution during the Mw7.8 and Mw7.5 earthquakes on 20th March. We have continuously carried out air photo-based interpretation near the eastern termination of surface rupture associated with the Mw7.5 event, and newly found surface rupture. The surface rupture extends 5 km east of the Doğanşehir fault zone (Emre et al., 2013), and it extends for about 14 km long. The maximum left-lateral displacement is up to 2.0 m at present. The location of this surface rupture, Doğanşehir segment, is in accordance with aftershock distribution extending to ENE direction. Between the Doğanşehir segment and the Çardak segment of main surface rupture, a 25-km-long gap of fault trace still exists. As a result, total surface rupture length becomes 138 km long including the 25-km-long gap, or 113 km long when the gap is excluded. Consequently, the Mw7.5 earthquake was a multi-segment earthquake that at least two fault segment have ruptured.
We here report detailed surface rupture distribution and slip distribution during the Mw7.8 and Mw7.5 earthquakes mainly based on air photo interpretation. As we have reported in the 2nd and 5th emergency reports (Kondo and Özalp, 2023) on GSJ website, the air photos were taken immediately after the occurrence of the earthquakes by General Directorate of Mapping in Turkey (HGM). GSJ/AIST and MTA have worked under the international cooperative research on ‘Paleoseismological Study on the East Anatolian Fault System, Turkey’. We have extensively carried out air photo interpretation and analysis in order to reveal detailed surface rupture distribution and slip distribution during the Mw7.5 event as well as Mw7.8 event. The surface rupture associated with the Mw7.5 event has been limitedly reported (e.g., Reitman et al., 2023), therefore we have tried to map the entire surface rupture and obtain the slip distribution along the fault.
The method of identification of surface rupture and measurement of displacement is the same photogrammetrical method as reported in Kondo and Özalp (2023). The number of localities of identified surface rupture is about 1000 points. The measurement sites for slip distribution are about 350 localities. We added the precisely determined aftershock distribution (Lomax, 2023) in order to compare with the surface ruptures and source faults at depth as shown in Fig. 1. This is a preliminary report, therefore, the contents and description might be modified and updated later, based on further analysis and progress of the research.
The length of surface ruptures during the Mw7.5 event is total ca. 100 km long (Fig. 1). The western termination of the rupture is about 2 km south of Göksun town. The eastern termination is about 40 km east from the epicenter, close to the western termination of the Sürgülü fault (Emre et al., 2013). The surface rupture is not likely to extend on the main section of the Sürgülü fault. Near the eastern termination of the surface rupture, the aftershocks extend to the ENE direction towards Malatya, though significant active fault and surface rupture are not identical along the aftershocks.
The slip distribution along the surface rupture is shown in Fig. 2. The maximum displacement associated with the Mw7.5 earthquake is 9.1 meter of left-lateral strike-slip movement as shown in the previous report (Fig. 2 of Kondo and Özalp, 2023). We could not identify apparent discontinuity of slip distribution and abrupt changes of the slip amount. This suggest that the Mw7.5 surface rupture consists of single fault segment (e.g., McCalpin, 1996; Kondo et al., 2004; Duman and Emre, 2013; Emre et al., 2021).
In addition with the Mw7.5, we re-visited and updated the Mw7.8 surface rupture and slip distribution. As Reitman et al. (2023) pointed out, surface rupture on a branch fault extends for about 7 km from Gölbaşı to the east. The amount of left-lateral displacement is up to 3.5m along the branch. As a result, the length of surface rupture during the Mw7.8 event is total ca. 320 km long; main East Anatolian fault is about 290 km, Narlı segment is about 25 km, Gölbaşı branch is about 7 km.
This report aims to reveal the whole extent of surface rupture during the Mw7.8 and Mw7.5 events and the slip distributions along the fault. Extensive field mapping and measurement will reveal more detailed surface rupture distribution and accurate slip distribution associated with the destructive earthquakes. Furthermore, we need to reveal recurrence behavior on individual fault segments in order to evaluate the occurrence of the devastating multi-segment earthquake.
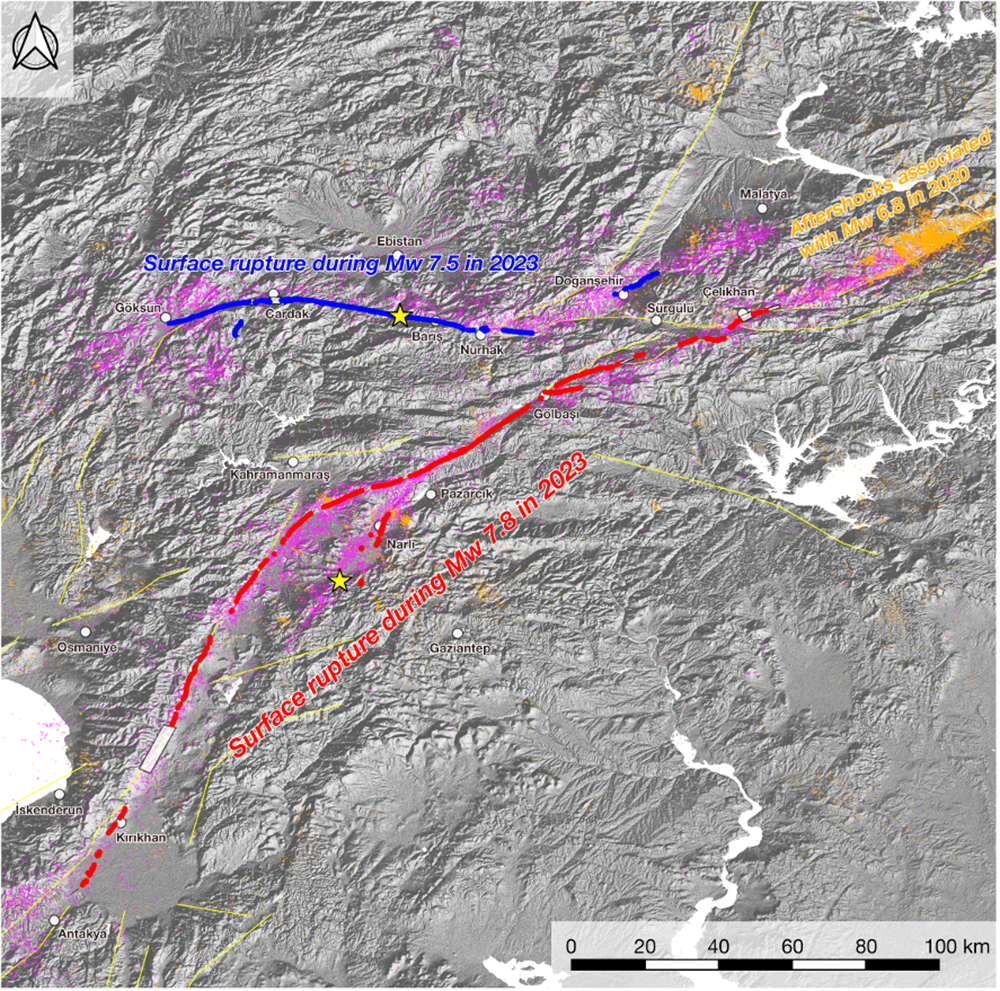
Fig. 1 Surface rupture distributions associated with the Mw7.8 and Mw7.5 earthquakes on the East Anatolian fault system. Red and blue dots indicate localities where surface rupture was identified on air photo interpretation; red denotes Mw7.8 surface rupture and blue denotes Mw7.5, respectively. White-colored rectangular denotes not interpreted area due to snow, cloud, forest, etc. Yellowish colored star is the epicenter after USGS website. Yellowish colored solid lines represent active fault traces (Emre et al., 2013; Styron and Pagani, 2020). Purple and orange dots indicate precise aftershock distributions relocated by Lomax (2023); purple dot denotes aftershocks between the occurrence of Mw7.8 and 4th March, and orange dot denotes aftershocks between 1st January 2020 and the occurrence of Mw7.8. The base map is shaded relief map produced by SRTM90 data.

Fig. 2 Slip distributions along surface rupture associated with the Mw7.8 and Mw7.5 earthquakes on the East Anatolian fault system. Red and blue circles indicate slip amount inferred from satellite image interpretation of the Mw7.8 and Mw7.5 events, respectively. Yellowish colored stars are the epicenters after USGS website.
The points examined for horizontal displacement of the fault are plotted in the figure. Surface offsets were measured visually, whose measurement error was estimated to be less than a few tens cm. If offset was not identified, it was expressed as zero. The segment boundaries (gray intervals in the figure) were determined based on the following information: 1) continuity of the surface trace of active faults, and 2) gradual horizontal decrease of the surface offset along the fault, followed by several km of continuous intervals where no offset is observed. In cases where surface offsets were not widely observable due to snow and cloud cover, the segment boundaries were determined by considering topographic features associated with active faults. If the data is limited, and there is uncertainty in setting the segment boundaries, we have marked question marks on the figure.
References
- Duman, T.Y. and Emre, Ö. (2013) The East Anatolian Fault: geometry, segmentation and jog characteristics. Geological Society of London Special Publication, 372 (1), p. 495–529.
- Emre, Ö., Duman, T.Y., Özalp, S., Elmacı, H., Olgun, Ş. and Şaroğlu, F. (2013) Active Fault Map of Turkey with and Explanatory Text. General Directorate of Mineral Research and Exploration, Special Publication Series-30. Ankara-Turkey.
- Emre, Ö, Kondo, H., Özalp, S. and Elmacı, H. (2021) Fault geometry, segmentation and slip distribution associated with the 1939 Erzincan earthquake rupture along the North Anatolian fault, Turkey. Geological Society of London Special Publications, 501(1), doi: https://doi.org/10.1144/SP501-2019-141
- HGM website, https://www.harita.gov.tr (Accessed: March 16, 2023)
- Kondo, H., Awata, Y., Emre, Ö., Doğan, A., Özalp, S., Tokay, F., Yıldırım, C., Yoshioka, T. and Okumura, K. (2004) Slip Distribution, Fault Geometry, and Fault Segmentation of the 1944 Bolu-Gerede Earthquake Rupture, North Anatolian Fault, Turkey. Bulletin of the Seismological Society of America, 95, 1234–1249. doi: https://doi.org/10.1785/0120040194
- Kondo, H. and Özalp, S. (2023) Second report 'Preliminary report on surface ruptures associated with Mw7.8 and Mw7.5 earthquakes in southern Turkey'. Geological Survey of Japan web site, https://www.gsj.jp/en/hazards/earthquake-hazards/turkey20230222.html
- Lomax, A. (2023) Precise, NLL-SSST-coherence hypocenter catalog for the 2023 Mw 7.8 and Mw 7.6 SE Turkey earthquake sequence. doi: https://doi.org/10.5281/zenodo.7699882
- McCaipin (1996) ‘Paleoseismology’, Academic Press, 588 pp.
- Reitman, N.G., Briggs, R.W., Barnhart, W.D., Thompson Jobe, J.A., DuRoss, C.B., Hatem, A.E., Gold, R.D., Mejstrik, J.D. and Akçiz, S. (2023) Preliminary fault rupture mapping of the 2023 M7.8 and M7.5 Türkiye Earthquakes. doi: https://doi.org/10.5066/P985I7U2
- Styron, R. and Pagani, M. (2020) The GEM Global Active Faults Database. Earthquake Spectra, 36, p.160–180. https://doi.org/10.1177/8755293020944182
- USGS web site, https://www.usgs.gov/news/featured-story/m78-and-m75-kahramanmaras-earthquake-sequence-near-nurdagi-turkey-turkiye (Accessed: March 16, 2023)
Contact: Geological Survey of Japan, AIST