Destructive earthquakes in southern Turkey(2023) top
Destructive earthquakes in southern Turkey on 6th February 2023 (Mw7.8 and Mw7.5)
The fifth report "Primary surface rupture and slip distribution associated with Mw7.8 earthquake in southern Turkey"
KONDO Hisao (Research Institute of Earthquake and Volcano Geology) and Selim Özalp (General Directorate of the Mineral Research and Exploration of Turkey (MTA))
We preliminarily report detailed surface rupture distribution and slip distribution during the Mw 7.8 earthquake based on airphoto interpretation. As we have reported in the 2nd emergency report on GSJ website (Kondo and Özalp, 2023), the airphotos were taken immediately after the occurrence of the earthquakes by General Directorate of Mapping in Turkey (HGM). GSJ/AIST and MTA have worked for an international cooperative research on ‘Paleoseismological Study on the East Anatolian Fault System, Turkey’. We have extensively carried out airphoto interpretation and analysis in order to reveal detailed surface rupture distribution and slip distribution during the Mw 7.8 event. The surface rupture has been partly reported (e.g., Çetin et al., 2023; Reitman et al., 2023), but we have tried to map whole surface rupture and obtain the slip distribution along the fault. Some area are still difficult to identify surface rupture due to lack of good quality photos, heavy snow, cloud, forest, shadow of mountains, etc.
The method of identification of surface rupture and measurement of displacement is the same photogrammetrical method as reported in Kondo and Özalp (2023). The number of localities of identified surface rupture is about 1700 points. The measurement sites for slip distribution are about 350 localities. This is a preliminary report, therefore, the contents and description might be modified and updated later, based on further analysis and progress of the research.
The length of surface ruptures during the Mw7.8 event is total ca. 310 km long (Fig. 1). The north-eastern termination of the rupture is 5 km east of Çelikhan, but heavy snow still covers further east. Therefore, minor surface rupture with smaller slip than a few tens cm is not visible now. Later on, we need to carry out field mapping to confirm the north-eastern termination of the surface rupture. The southernmost termination is about 15 km north-east from Antakya. Between the southern termination and Hatay airport, numerous liquefaction is produced associated with en echelon ruptures with open cracks. In addition, north to south trending surface rupture extends near the epicenter, as Reitman et al. (2023) has mapped and reported.
The slip distribution along the surface rupture is shown in Fig.2. The maximum displacement associated with the Mw 7.8 earthquake is 7.7 meter of left-lateral strike-slip movement as shown in previous report (Fig. 2 of Kondo and Özalp, 2023). Both events extend mostly along the previously-mapped active faults (e.g., Emre et al., 2013). The slip distribution exhibits discontinuities and abrupt changes of the slip amount. Such variation of slip corresponds to surface fault discontinuities indicating the fault segments (e.g., McCalpin, 1996;Kondo et al., 2004;Duman and Emre, 2013;Emre et al., 2021). Judging from present dataset of surface rupture and slip distribution, we suggest the surface rupture is divided into five fault segments. In this case, the Mw7.8 earthquake was a multi-segment earthquake that five segments simultaneously ruptured along the East Anatolian fault system.
This report aims to reveal the whole extent of surface rupture during the Mw7.8 event and the slip distribution along the fault. Extensive field mapping and measurement will reveal more detailed surface rupture distribution and accurate slip distribution associated with the destructive earthquakes. Furthermore, we need to reveal recurrence behavior on individual fault segments in order to evaluate the occurrence of the devastating multi-segment earthquake.
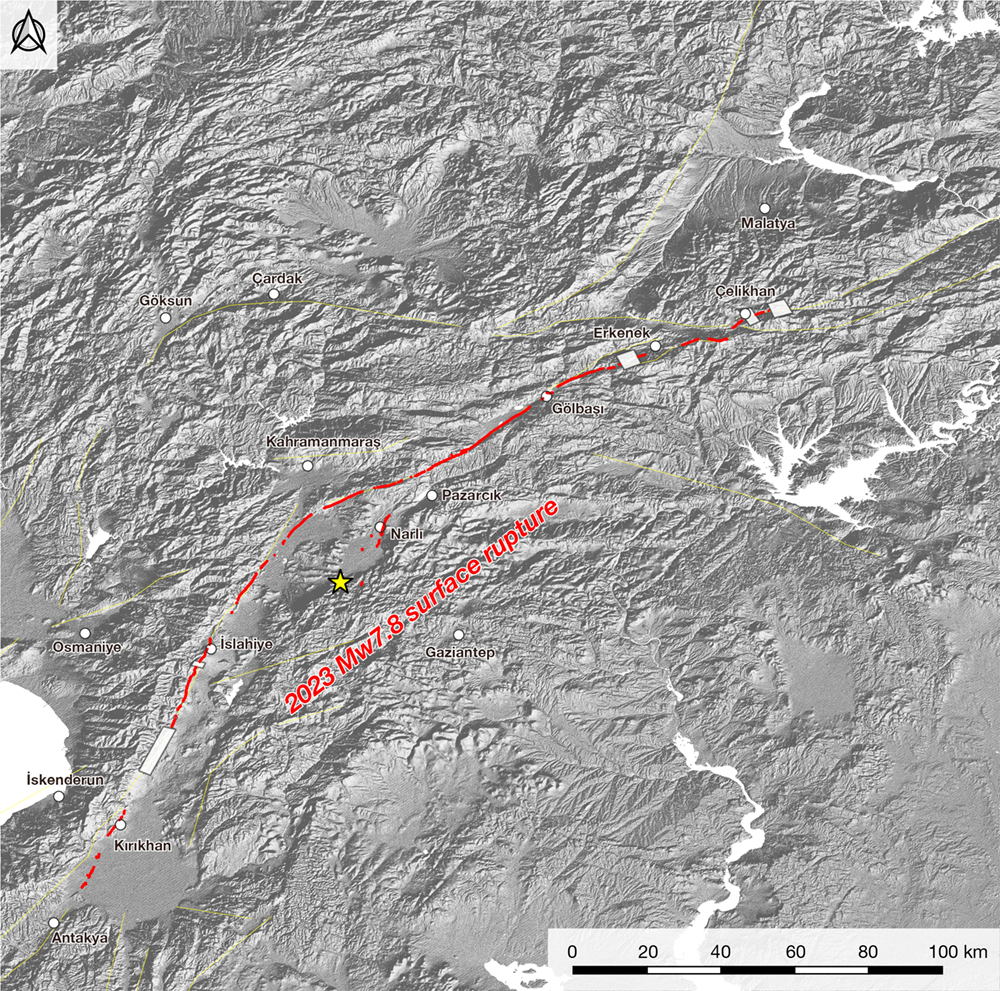
Fig. 1 Surface rupture distribution associated with the Mw7.8 earthquake on the East Anatolian fault system. Red dots indicate localities where surface rupture was identified on air photo interpretation. White-colored rectangular denotes not interpreted area due to snow, cloud, forest, etc. Yellowish colored star is the epicenter after USGS web site. Yellowish colored solid lines represent active fault traces (Emre et al., 2013; Styron and Pagani, 2020). The base map is shaded relief map produced by SRTM90 data.
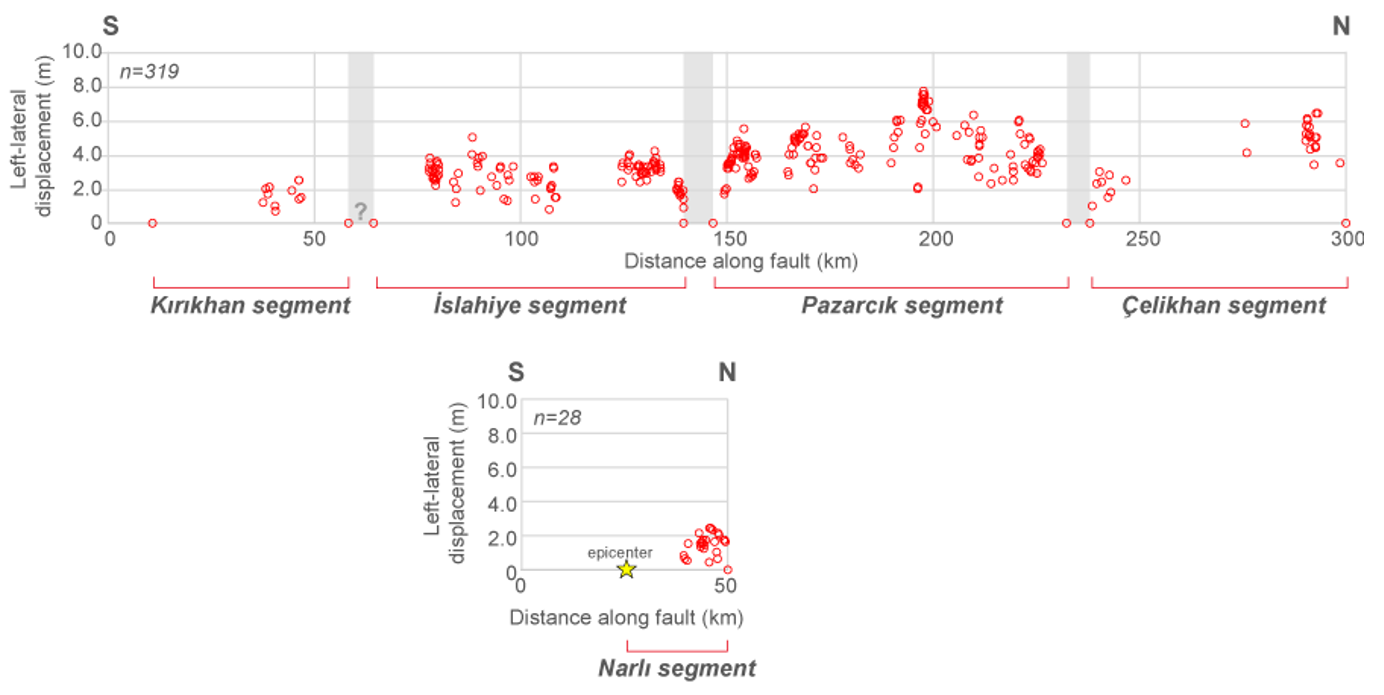
Fig. 2 Slip distribution along surface rupture associated with the Mw7.8 earthquake on the East Anatolian fault system. Red circles indicate slip amount inferred from satellite image interpretation. Yellowish colored star is the epicenter after USGS web site.
The points examined for horizontal displacement of the fault are plotted in the figure. Surface offsets were measured visually, whose measurement error was estimated to be less than a few tens cm. If offset was not identified, it was expressed as zero. The segment boundaries (gray intervals in the figure) were determined based on the following information: 1) continuity of the surface trace of active faults, and 2) gradual horizontal decrease of the surface offset along the fault, followed by several km of continuous intervals where no offset is observed. In cases where surface offsets were not widely observable due to snow and cloud cover, the segment boundaries were determined by considering topographic features associated with active faults. If the data is limited, and there is uncertainty in setting the segment boundaries, we have marked question marks on the figure.
References
- Çetin, K., M. Ilgaç, G. Can, E. Çakır (eds.) (2023) Preliminary Reconnaissance Report on February 6, 2023 Kahramanmaraş-Pazarcık (Mw=7.7) and Elbistan (Mw=7.6) Earthquakes, METU/EERC 2023-01, METU - Earthquake Engineering Research Center, pp. 91.
- Duman, T.Y. and Emre, Ö. (2013) The East Anatolian Fault: geometry, segmentation and jog characteristics. Geological Society of London Special Publication, 372 (1), p. 495–529.
- Emre, Ö., Duman, T.Y., Özalp, S., Elmacı, H., Olgun, Ş. and Şaroğlu, F., (2013) Active Fault Map of Turkey with and Explanatory Text. General Directorate of Mineral Research and Exploration, Special Publication Series-30. Ankara-Turkey.
- Emre, Ö, Kondo, H., Özalp, S. and Elmacı, H. (2021) Fault geometry, segmentation and slip distribution associated with the 1939 Erzincan earthquake rupture along the North Anatolian fault, Turkey, Geological Society of London Special Publications, 501(1), doi: https://doi.org/10.1144/SP501-2019-141
- HGM website, https://www.harita.gov.tr (Accessed: March 7, 2023)
- Kondo, H., Awata, Y., Emre, Ö., Doğan, A., Özalp, S., Tokay, F., Yıldırım, C., Yoshioka, T. and Okumura, K. (2004) Slip Distribution, Fault Geometry, and Fault Segmentation of the 1944 Bolu-Gerede Earthquake Rupture, North Anatolian Fault, Turkey. Bulletin of the Seismological Society of America, 95, 1234–1249. doi: https://doi.org/10.1785/0120040194
- Kondo, H. and Özalp, S. (2023) Second report 'Preliminary report on surface ruptures associated with Mw7.8 and Mw7.5 earthquakes in southern Turkey', Geological Survey of Japan web site, https://www.gsj.jp/en/hazards/earthquake-hazards/turkey20230222.html
- McCaipin (1996) ‘Paleoseismology’, Academic Press, 588 pp.
- Reitman, N.G., Briggs, R.W., Barnhart, W.D., Thompson Jobe, J.A., DuRoss, C.B., Hatem, A.E., Gold, R.D., Mejstrik, J.D. and Akçiz, S. (2023) Preliminary fault rupture mapping of the 2023 M7.8 and M7.5 Türkiye Earthquakes. doi: https://doi.org/10.5066/P985I7U2
- Styron, R. and Pagani, M. (2020) The GEM Global Active Faults Database. Earthquake Spectra, 36, p.160–180. https://doi.org/10.1177/8755293020944182.
- USGS web site, https://www.usgs.gov/news/featured-story/m78-and-m75-kahramanmaras-earthquake-sequence-near-nurdagi-turkey-turkiye (Accessed: March 7, 2023)
Contact: Geological Survey of Japan, AIST