Geological Mapping on Land
-To make them more familiar to our life-
Last Updated: April 13, 2021
Geological maps of the highest quality in the world
The creation of geological maps is one of the most important projects in the national Intellectual Infrastructure Development Plan. This project aims to elucidate the geology of our country and to make the basic geological information available to the public so as to ensure a safe and secure society and sustainable development. The Geological Survey of Japan has published many quadrangle geological maps*1 at various scales including 1:50,000 and 1:200,000 since its establishment in 1882.
Japan is located in a plate subduction zone and has many active faults and volcanoes. Due to this condition, its geology is very complex and diverse compared to most other countries, ranging from plutonic, metamorphic, and sedimentary rocks of the Paleozoic to Holocene. Accurate and high-resolution geological maps are crucial to understand this complex geology. The maps of the 1:50,000 Quadrangle Series, created based on hundreds of days field works, are one of the most accurate and detailed quadrangle geological maps in the world. The Geological Maps of Japan 1:200,000*2 are compiled from the 1:50,000 quadrangle maps and the series completed by 2010, having covered all the area of Japan.
Creating geological maps greatly contributes to the development of geological science. It leads to the revelation of the geological history of the area and to the establishment of stratotype and geological standards. Geological maps are used in society in many situations: constructing lifelines such as tunnels, dams and bridges; determining industrial locations and dumping sites; exploring natural resources; promoting regional development for tourism; developing geohazard measures; creating hazard maps, etc.
Let’s take one example. There are geological cross-sections drawn in most quadrangle geological maps covering plain areas. Scrutinizing the cross-section of an alluvial plain area, you will see that the thickness of the alluvium varies with the location. Areas where the alluvium is thick are ancient valleys buried with soft sediments, which would amplify seismic shaking. Therefore, the areas with thicker alluvium can suffer increased damage in an earthquake compared to those without or with thinner one, even though there is little difference between their topographic features. As such, geological maps give you crucial underground information that can be helpful in deciding where to locate houses and buildings. Detailed geological maps provide very helpful information in many situations.
Easy access to geological maps from anywhere and at anytime
A geological map is a visual expression of what the land has gone through. These data are reconstructed and interpreted by assembling a wide range of geological information based on the latest research results of the time. Therefore, it sometimes happens that the distribution of rocks between adjacent maps do not match well and are discontinuous if they are created by different geologists or at different times.
The Seamless Digital Geological Map of Japan (1:200,000)*3, online geological map covering the whole Japanese islands, was published after the unification of legends and reinterpretation of the geology to smoothly connect the gap between each map; all of the nation’s geological maps are integrated into one seamless geological map.
The map is zoomable on a display of PC, tablet and mobile phones. Brief information of the local geology such as the name and age of the rock pops up by clicking on the map. While the map provides abundant information, it is also user-friendly and easy-to-understand for general users. Other geological databases, such as those on active faults and volcanoes, can be overlaid on the map, too. The map can display the geological distribution in 3D, which enables visual understanding of the relationship between geology and landforms. Out in the field, you can immediately display the geology beneath your feet on your smartphone.
GeomapNavi is another online geological map display system designed to overlay any of other earth science maps of GSJ, the Quadrangle Geological Map Series, the Marine Geology Map, the Gravity Map Series, the Geochemical Map, and many others, on the Seamless Digital Geological Map of Japan. Maps published and distributed by other organizations, for example, the Landslide Maps by the National Research Institute for Earth Science and Disaster Resilience, Japan, and the National Seismic Hazard Map for Japan by the Headquarter for Earthquake Research Promotion, are also available. Combining these maps, the relationship between geology and other information can be seen.
We aim to make geological maps more user-friendly and as useful as weather maps in everyday life.
Annotations
*1: A geological map whose boundaries coincide with latitudes and longitudes
*2: A geological map compiled from existing geological data, adding the author’s own data and
interpretation
*3: The first version of the Seamless Digital Geological Map of Japan (1:200,000) was developed in 2006 and
the revised highly accurate version V2 was released in 2015.
Link:
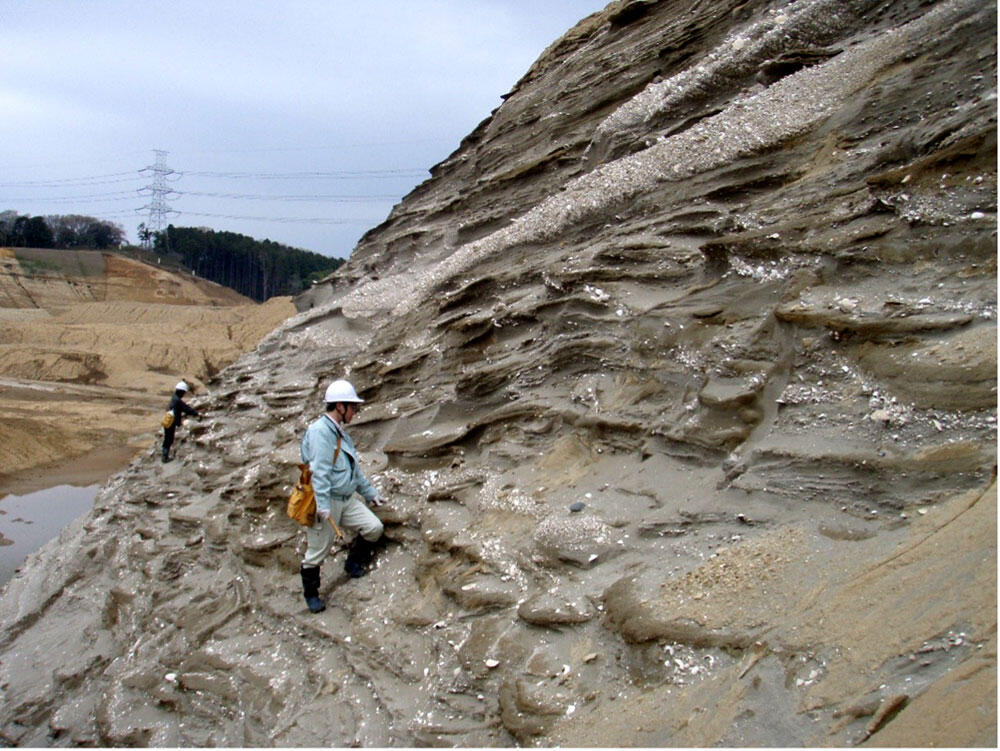
In the field, geologists measure the strike, dip and thickness of the strata, identify rocks and collect samples for further analysis
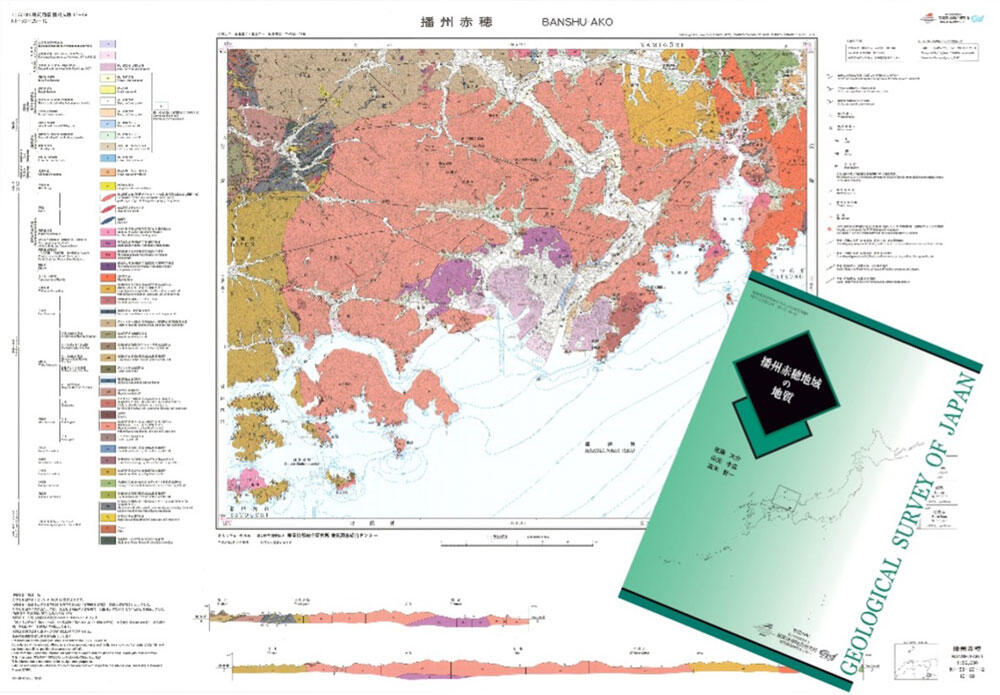
The geological map of Banshu-Ako in the Quadrangle Series 1:50,000 and its explanatory. The map revealed that the gigantic caldera was formed by a large eruption during the late Cretaceous
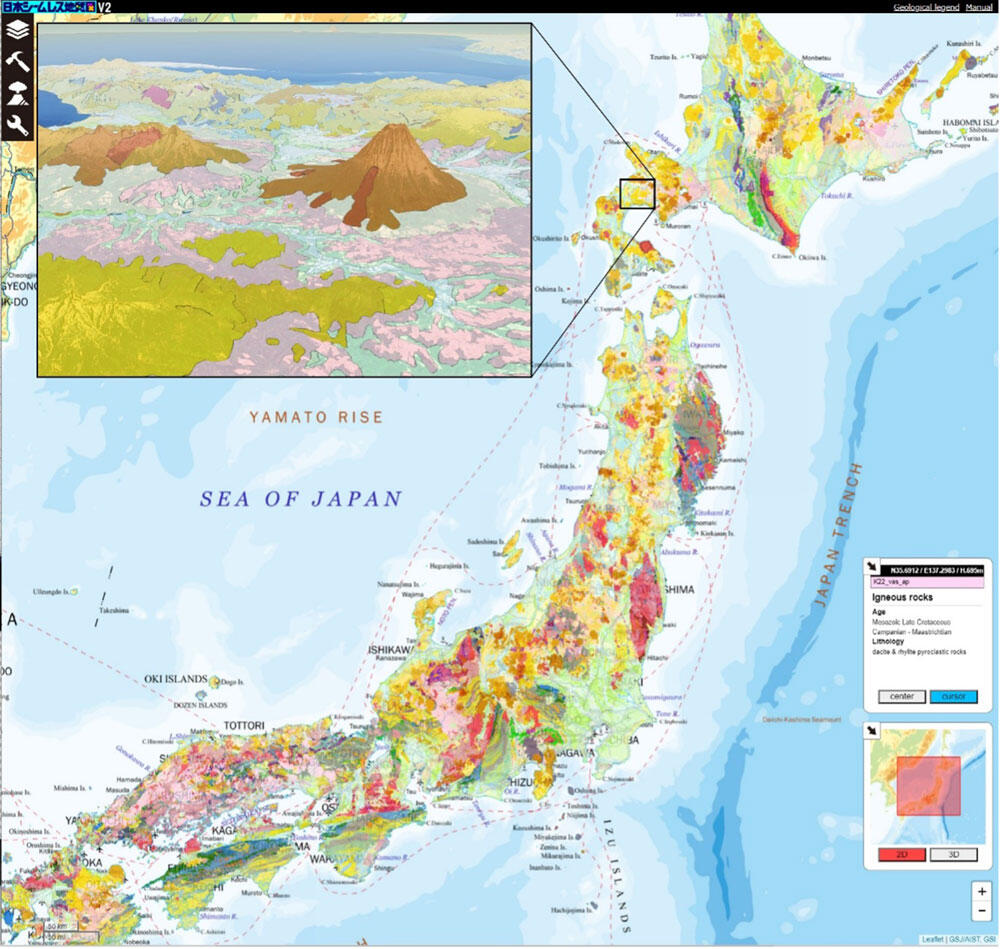
A screenshot of the Seamless Digital Geological Map of Japan (1:200,000).
Enlarged figure in upper left is the 3D display of Mt. Yotei and surrounding area