< 前のページへ戻る
|
|
大阪平野下に伏在する上町および生駒断層帯の地質学的断層−褶曲モデル
|
|
|
第1図.(a) 近畿地域の活断層図.活断層の位置は池田ほか編(2002)および中田・今泉編(2002)に基づく.陰影図は国土地理院発行の250mDEMを使用して作成した.図中の略称は以下の通り:OS:大阪市,KT:京都市,NG:名古屋市.図中の星印は1995年兵庫県南部地震の震央位置を示す.
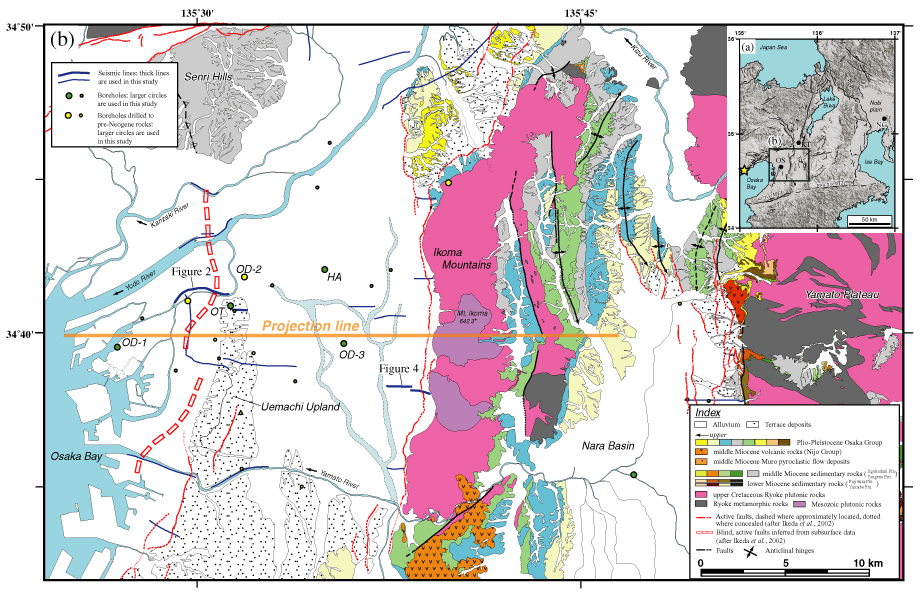
(b) 大阪平野北部の地質図.地質図は尾崎ほか(2000),西岡ほか(2001),宮地ほか(1998)および宮地ほか(2001)を改変.活断層の位置は池田ほか編(2002)に基づく. オレンジ色の太線は,第7図に示す東西地質断面図の投影線である.
Fig. 1. (a) A shaded relief map based on a 250 m digital elevation model, showing the topography and distribution of active faults within Kinki region, central Japan. Locations of active faults are from Ikeda et al. (2002) and Nakata and Imaizumi (2002). Note a major compressional termination of the eastern end of the strike-slip active MTL, which corresponds with the northern end of higher topographic domains of the Outer Belt. The Kinki region north of the MTL is characterized by an array of N-trending active thrusts juxtaposed with Neogene basins. Abbreviations for cities are as follows: OK: Osaka, KT: Kyoto, NG: Nagoya. Asterisk indicates the hypocenter of the disastrous 1995 Hyogo-ken Nanbu (Kobe) earthquake (MJMA7.2).
(b) Geologic map of the northern Osaka plain with locations of active fault and fold scarps, modified from Miyachi et al. (1998), Miyachi et al. (2001), Nishioka et al. (2001), and Ozaki et al. (2000). Locations of active faults are from Ikeda et al. (2002). Location of seismic sections and boreholes is also shown. Abbreviations for borehole locations are: HA: Hama (Yoshikawa et al., 1998). Line of projection of schematic cross section (Fig. 7) is shown as thick, orange line.
|
|
|
|