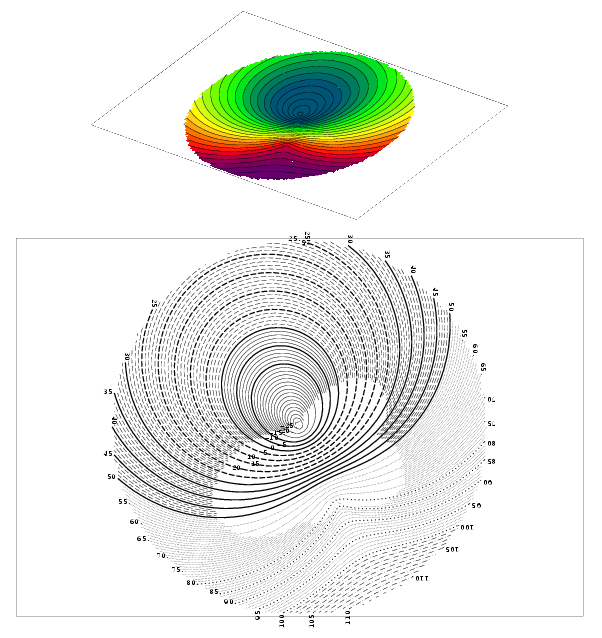
Line Contour Map (CONT)
CONTS, CONTSO, CONTX
NAME
    conts  - Specify rectangle frame for 2D contouring by 'contx'
    contso - Specify slant frame for 2D contouring by 'contx'
    contx, contr - Execute contour map drawing
             2D array data with arbitrary dimension size is represented
              into contour map of normal and capital lines, with respective
              specified line types.
             Only capital lines are drawn where the contour is crowded.
             Contour values are assigned at both end of capital lines (at one
              place if the line is closed).
             Memory area for the work is allocated dynamically.

SYNOPSIS

      call conts(xorg, yorg, wide, high, imax, jmax, csize)
  xorg, yorg [float] Coordinates (in cm) of base point to draw contour map
  wide       [float] Width (in cm) of the contour map
                     If minus, drawn on the left side of base point.
  high       [float] Height (in cm) of the contour map
                     If minus, drawn on the bottom side of base point.
  imax, jmax [int]   Number of grids to the right and to the top,
                      counting both ends, which also specify the
                      dimensions of adjustable array.
        In usual case, imax>0 and jmax>0, the array declaration is like
         `dimension v(imax,jmax)`, where array elements are ordered toward
         right first and then to top.   If array elements are ordered to
         top and then toward right, both imax and jmax shall be given as
         negative values, where the array declaration is supposed to be like
         `dimension v(-jmax,-imax)`.
        In any case, even if wide<0. and/or high<0.,
         v(1,1) is attributed to the base point (xorg,yorg).
  csize      [float] Character size (in cm) of contour value drawing
                     If zero or negative, contour values are not drawn.

      call contso(x0, y0, x1, y1, x2, y2, imax, jmax)
  x0, y0   [float] Coordinates (in cm) of base corner of the frame to draw.
  x1, y1   [float] Coordinates (in cm) of 2nd corner
                    corresponding to the array element (imax,1).
  x2, y2   [float] Coordinates (in cm) of 3rd corner
                    corresponding to the array element (1,jmax).
  imax, jmax [int] Number of grids (must be imax>1, jmax>1) counting both
                    ends, which also specify dimensions of adjustable array.
        Three corners above, along with the 4th corner (x1+x2-x0, y1+y2-y0),
         define the slant grid frame of drawing. Contour values are not drawn.

      call contx(v, undef, istep, lcapt, lml, lmh, kln)
      call contr(v, undef, step, lcapt, vlml, vlmh, kln)
  v          [float] 2D array defining grid data (imax*jmax elements in total)
  undef      [float] Special value of grid data indicating no-data area
  istep      [int]   Contour interval (must be positive integer)
  step       [float] Contour interval (must be positive)
  lcapt      [int]   Capital line interval ratio (m).
                     Capital lines are placed every m-th line of contours.
                     If given as negative value, all contours are drawn even
                      where crowded contours.
  lml, lmh   [int]   Lower and upper bound of contour values to draw contours
                      (must be integers)
  vlml, vlmh [float] Lower and upper exception range values for contour drawing
  kln        [int]   Specify line type of contours (0-16)
                      For capital contours,
                       0: solid, 1: broken, 2: dotted, 3: chained line;
                       4-6: solid line;  7-9: none (no lines drawn);
                       10-16: same as 0-6 but using pen number 2.
                      For normal contours,
                       0: solid, 1: broken, 2: dotted, 3: chained line;
                       4,7: broken, 5,8: dotted, 6,9: chained line;
                       10-16: same as 0-6 but using pen number 1.
                      Refer to 'newpen' for pen number selecting.
                      In any case, the pen number selected before drawing
                       contour map is recovered at the end of contouring.

EXAMPLE

      dimension f(151,101)
      do 100 i=1,151
        x = float(i-76)
        a = float(i-86)
        do 10 j=1,101
          y = float(j-51)
          b = float(j-31)
          r = sqrt(x*x + y*y)
          s = sqrt(a*a + b*b)
          f(i,j) = r*3. - s*2. + 17.
          if(r.gt.50.) f(i,j) = 999.
  100 continue
      call psopn('cont.ps', 'a4p')
      call plots(0., 0.)
      call wrect(2., 2., 15., 10.)
      call conts(2., 2., 15., 10., 151, 101, 0.12)
      call contx(f, 999., 1, 5,-100, -11,  0)
      call contx(f, 999., 1, 5, -10,   0, 10)
      call contx(f, 999., 1, 5,   1,  25, 11)
      call contx(f, 999., 1, 5,  26,  50, 14)
      call contx(f, 999., 1, 5,  51,  75,  2)
      call contx(f, 999., 1, 5,  76, 100, 12)
      call contx(f, 999., 1, 5, 101, 200,  3)
      call plot( 4., 15., -3)
      call plot( 7.,-2.5, 2)
      call plot(11., 0.5, 2)
      call plot( 4., 3. , 2)
      call plot( 0., 0. , 2)
      call dfcols(0)
      call dframo(0., 0., 7., -2.5, 4., 3., 151, 101)
      call contso(0., 0., 7., -2.5, 4., 3., 151, 101)
      call paintm(f, 0., 100., 999.)
      call contx(f, 999., 5, 4, -50, 150,  0)
      call plote
      call pscls
      stop
      end