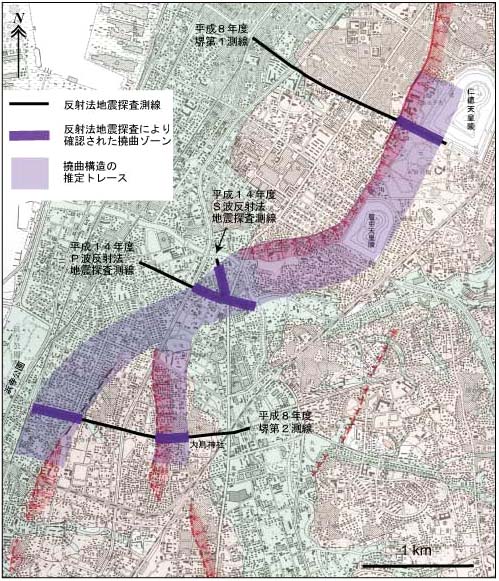
Fig. 1. Distribution of flexure zones (thick dark violet lines) confirmed by seismic reflection profiling and inferred trace of the flexure (pale violet belt). Base map: 1: 25,000 Active Fault Map in Urban Area "Osaka seinanbu" (Nakata et al., 1996) published from the Geographical Survey Institute. Light gray and light pink areas are alluvial lowland and lower terrace surface, respectively. Deep pink belts with red arrows are flexures on the lower terrace surfaces.