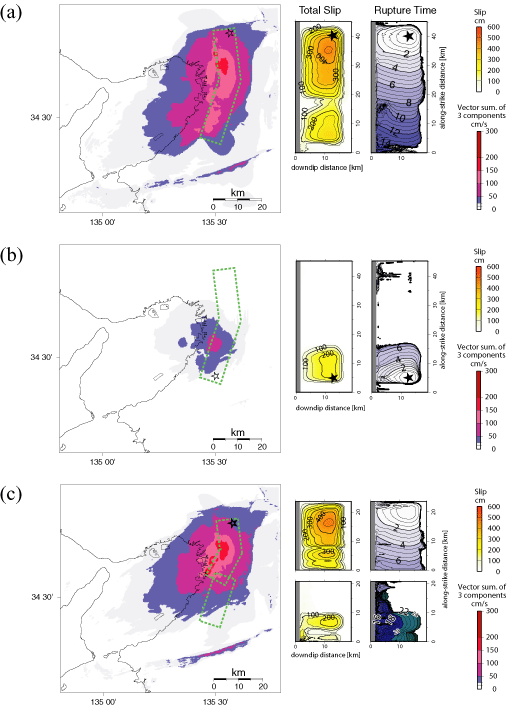
Fig. 2. Total slip and rupture time distributions of rupture scenarios and the peak ground velocity (vector summation of three components) distribution from the rupture scenarios in the three dimensional Osaka sedimentary basin structure model. (a) The case when the fault plane is a single segment and a hypocenter (star) is assumed near the northern margin of the fault system. (b) The case when the fault plane is a single segment and a hypocenter is assumed near the southern margin of the fault system. (c) The case when the fault plane consists of two segments and a hypocenter is assumed near the northern margin of the fault system.