第1図.上町断層系を1セグメントとした場合の初期応力分布.灰色の部分は,破壊が起こらない部分(堆積層内)を示す.(a) 上町断層系の平均上下変位速度分布 (関口ほか 2003).(b) 関口ほか (2003) で推定された断層面上のすべり量分布.(c) 関口ほか (2003) で推定された断層面上の応力降下量分布.(d) 応力降下量分布から求めた断層面上の強度分布.
Fig. 2. Heterogeneous distribution of initial stress field for the Uemachi fault system (1-segment model). Grey areas indicate where rupture does not occur inside sediment layer. (a) Average uplift rate along fault trace (Sekiguchi et al., 2003). (b) Slip distribution on the fault estimated by Sekiguchi et al. (2003). (c) Stress drop distribution on fault estimated by Sekiguchi et al. (2003). (d) Strength excess distribution on fault estimated from the stress drop distribution.
|
 |
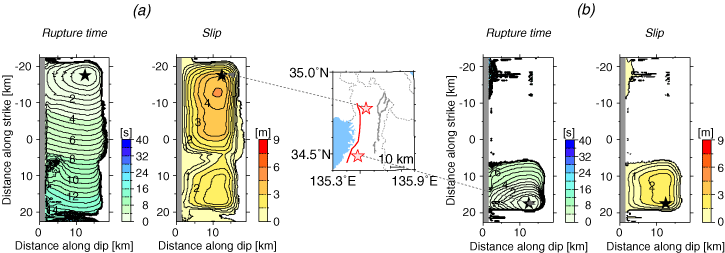
第2図.上町断層系を1セグメントとした場合の破壊過程.(a) 破壊開始点を断層系の北端に置いた場合.(b) 破壊開始点を断層系の南端に置いた場合.
Fig. 7. Rupture processes of the Uemachi fault system (1-segment model). (a) A hypocenter is located near the northern end of the fault system. (b) A hypocenter is located near the southern end of the fault system.
|
 |